Accepting Conflict Within a Framework of Culture
Despite living in a unipolar world branded by a thousand-year peace banner, conflict and culture appear to have escalated instead of the decreasing as expected through the mostly peaceful submission by citizenries. Wars and civil unrest increased since the fall of the Berlin Wall while cultures are polarized between national and global paradigms.
This process accelerated with the 2008 Great Recession while the next recession is expected in 2023 because society never adapted to the needs made clear in 2008, despite having the means to do so. The requirements for change were never recognized or adopted.
I propose a new method to enable realistic change recognition, motivate adaptation, and establish the means to do so. Historically conflicts were generally addressed at the organizational level with peace treaties. Within a single organization, conflict with employees are addressed on mostly an individual basis despite the efforts of unions to force whole industries to agree on salaries and benefits.
Current situations point to three levels of conflict happening simultaneously. For example, Britain has sanctioned an individual in Uganda, despite the two countries being on jovial footing where Princess Anne visited Kampala and President Museveni visited London in the course of 2022. Obviously, there are many other similar examples.
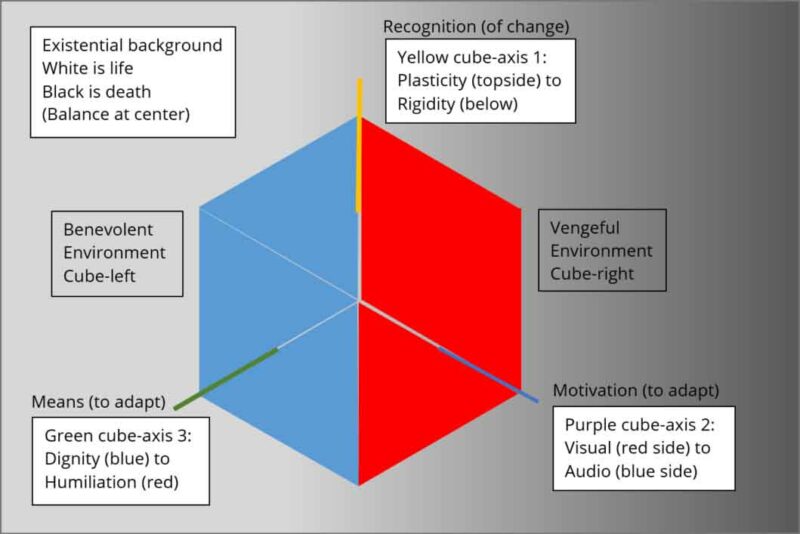
Therefore, to detect changes that may affect conflicts or cultures (or vice versa), one must obtain data of the current situation, as well as the desired situation separately, at three levels:
- Global level with respect to life and death (various manifestations across the world)
- Organizational environment with respect to benevolence and vengefulness (locally)
- Individual feedback on the following (per local area)
- Recognition axis (continuum) – plasticity vs rigidity
- Motivation axis (continuum) – visual vs audio
- Means axis (continuum) – dignity vs humiliation
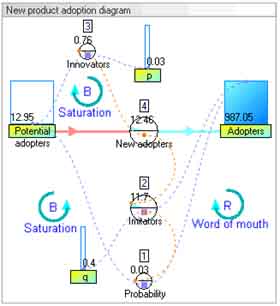
The data of the current situation will then be put into the simulation below from which it can assess whether the desired situation is possible or to what extent it is possible.
Once the feasibility and viability are assessed, the means to implement the adaptation is obtained with which society can then evolve as intended and within natural limits.
Further explanation of parameters used are as follows:
- Life and death: There are 200 odd countries in the world with each having its own existential issues including crime rates, infant mortality rate etc. These can all be distilled to (possibly) 8 themes/areas if needed. What is included is not just statistics, but assessments of foreign and local policies and associated history of activities indicating the likelihood of life or death experienced.
- Benevolence and vengefulness: Local areas may be a single country and/or a region where some organizations have demonstrably impacted other associated organizations and individuals. This allows for multiple/repeat/parallel analysis formats.
- Plasticity and rigidity: This also refers to flexibility and rule-based personal orientations. For example, a soldier is somebody that is required to shoot rather than negotiate, whereas a salesperson is more flexible at selling a car because there is always a next customer.
- Visual and audio: Some people are more visual oriented while others are audio oriented. Some paint while others prefer writing. Some communicate better verbally than visually.
- Dignity and humiliation: Some cultures highlight dignity as culturally important while others highlight humiliation as merely funny in comedy. Both dignity and humiliation can however also lead to violence depending on exacerbating circumstances. For example, a Korean pilot-in-training will allow his Captain to crash the aircraft without saying a word.
The important part of all this data management is the visualization part because it puts the visual and writing together in a coherent three-dimensional picture. Imagine not just one page, but two hundred pages on top of each other.
One can expect thousands of data points clumping together in various parts of the 3D model. This can then be optimized to ascertain specific parameters of interest. But the important understanding is that the optimal concentration of data points should be in the balanced center. However, different data concentrations are expected, rather than unexpected.
Tags: conflict, management theory, unipolar world


